S&P+ did not have a good year. I don’t personally think they had a good year at all, but they definitely didn’t have a good year in terms of Army Football, and I really only care about Army.
Observe:
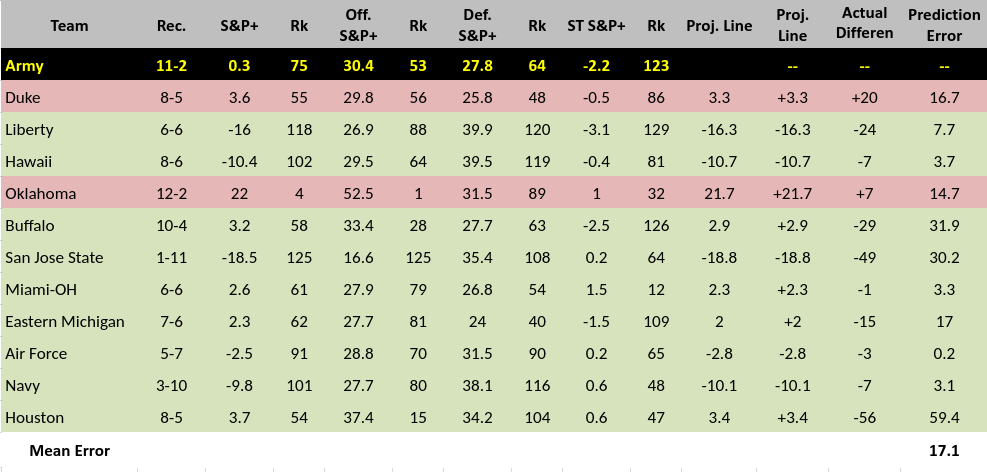
S&P+: Army Football vs. the 2018 Schedule
The thing that drives me crazy about the guys that use S&P+ is the way that they continually defend a system that has demonstrably missed the mark after the fact. If Team A beats Team B, that’s all that really matters. Some of this modeling stuff is like trying to add style points to football, which—Thank God—are not actually a thing. But it gets egregious when Team A beats Team B by 56 points, and some wonk is still out there trying to argue that Team B was the better team. Really, even when these guys are just talking about how their model says that some set of results were extremely unlikely, I mean, who cares?
In what universe does that stuff matter?
The nation's top two active college football winning streaks.
Clemson: 15 games
Army: 9 games#GoArmy pic.twitter.com/Eh0tOkB5B1— Army Football (@ArmyWP_Football) January 8, 2019
It got so bad this year that we at AFF quit using S&P+ altogether. The model was anti-predictive to the point that it was actively unhelpful. I don’t love ESPN’s FPI model, but it at least acknowledges confidence intervals alongside its picks. They have a whole section about how something that’s 75% likely is still 25% unlikely and what that means exactly. Alongside our own simple point differential calculations (using P[Wins]), this gave us a (somewhat) useful starting point for discussions about betting lines. That’s not nothing. As we’ve noted in our last podcast, we had a pretty terrific year against the spread this season.
But I happen to know this S&P+ stuff drives some of our team members crazy, and I think it informed some of the year end AP Poll voting as well, so it’s maybe worth spending some time talking about why S&P+ doesn’t work for Army. Football Outsiders defines S&P+ metrics in terms of five factors, and really, as soon as I lay this out, you’re gonna see the problems right away.
The Five Factors of S&P+
Efficiency. Defined in terms of Success Rates. 50% of the required yards on first down, 70% on second down, and 100% on third and fourth downs. So if your team doesn’t make the line to gain on third down, they fail, even if they make it on fourth down.
Explosiveness. Yards/play.
Field Position. This is an attempt to measure both Special Teams efficacy as well as the effect of getting turnovers in plus territory.
Finishing Drives. Red Zone Success Rate plus Field Goal Success Rate.
Turnovers. FO has a long explanation for why turnovers are a lot more random than they look, but they then note that turnovers correlate with sack rates, both for and against.
You’ve figured it out, right? Obviously, the problems in measuring Army exist in the first two factors.
Let’s talk about why they exist.
Football Outsiders is primarily a pro-football site, and as such, they defined their proprietary metric for the NFL first. It should therefore come as no surprise that it makes more sense in a pass-happy league. To put that another way, you’ll see all manner of guys arguing these days against running the football on first or second down because, bottom line, successful passing attempts tend to gain more yards. So if you throw on first, second, and third down, you really only need to make one of those work in order to move the chains.
This is absolutely true in the NFL. NFL quarterbacks are easily accurate enough, and the NFL’s rules strongly favor passing, both to enhance player safety and because the League thinks its fans want more passing. It’s also true in college to the extent that most major colleges are trying to run systems that appeal to kids who hope to one day turn pro. I’ll also agree with the basic logic that playing disciplined football is not easy over the course of a series of long, run-based drives. It’s hard to be perfect over and over again. However, this is less of a problem for explosive offenses.
Still, all of this makes much less sense if we start talking about what we might think of as traditional college offenses, i.e. the Wishbone, Wing-T, etc. These are styles specifically designed to grind out long drives and dominate time-of-possession. Granted, there aren’t a ton of folks running this stuff anymore, but hey. If the Ravens win the Super Bowl behind QB Lamar Jackson next year, maybe some of that old grind-it-old smashmouth will come back into vogue. In any event, I don’t think it’s a coincidence that the best teams in the League are also the best running teams.
Regardless, the biggest problem with treating Efficiency and Explosiveness as our primary metrics is that these measures assume that every play and every yard is essentially equal. That is obviously not true, and the Finishing Drives metric seeks to correct the fallacy, but Red Zone offense and Defense are only part of the issue. Time-of-Possession is also a real thing, granted not much in vogue in the “tempo” decade, as are the interdependencies of other non-metrics such as Game Control, Offensive Consistency, and Defensive Stamina, both for and against. Bottom line, the current metrics are not much good at measuring the effects of playing complimentary football. This creates chaos.
Proud.#GoArmy pic.twitter.com/1TKJxrqI5E
— Army Football (@ArmyWP_Football) January 8, 2019
Example Problem
Consider two teams. Team A runs every play, averages 3.1 yards/play, goes for it on every fourth down, and converts 90% of its fourth downs. Team B throws every play, completing 80% of its passes for a whopping 14 yards/play, but also takes a sack or other negative yardage play on about every 4th play. With this, Team B averages a little more than 8 yards/play but with no consistency at all. Team B is great on a yards/play basis, but the standard deviation of their yards/play metric is also truly enormous. Still, Team B is arguably the most explosive team in college football.
You tell me who’s going to win if these two teams play. Now, which team is the model going to predict as the winner?
Team B starts. They drive the length of the field, take an ill-timed sack, and have to kick a field goal. Team A then gets the ball, drives the length of the field, and scores. Their drive goes 24 plays in a whopping 14 minutes, 6 seconds. By the time Team B gets the ball again, we’re deep into the second quarter, and if Team B has to kick another field goal, they’re pretty much toast. We all see that, right?
Oh by the way, Team A gets the ball to start the second half.
What’s most interesting is that Team A will have failed on S&P+ style points on 75% of their snaps, both offensive and defensive. They fail every first down, every second down, and every third down on offense, but because they have to gain less than one yard on each of their fourth down plays, they almost always make it. Maybe they miss one every other game. It’s worse on defense. By giving up more than 8 yards/play, these guys look like they are flat getting torched. But because they get the occasional sack in the Red Zone, and because their offense dominates time-of-possession so overwhelmingly, their scoring defense is actually excellent in terms of points allowed.
The D was STOUT on 3rd down in 2018!#GoArmy pic.twitter.com/P2w07joqpK
— Army Football (@ArmyWP_Football) January 7, 2019
Final Thoughts
I will agree that measuring the impacts of complimentary football is not easy. Fortunately, I don’t have to fix the problem. It’s enough for me to throw rocks at another guy’s glass house.
Fortunately, enough AP and Coaches Poll voters cared about the actual results to put Army in the Top 20, so I’m good. I just think folks need to understand what they’re seeing when they see predictions from these models. We need to understand what the models are telling us and what they’re not telling us if we’re going to talk about them.
21 wins over the past two seasons!#GoArmy pic.twitter.com/9rZ7o8dsAU
— Army Football (@ArmyWP_Football) January 5, 2019




2 Comments
Leave your reply.